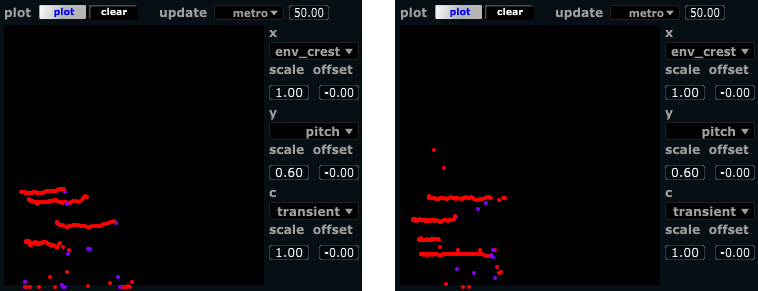
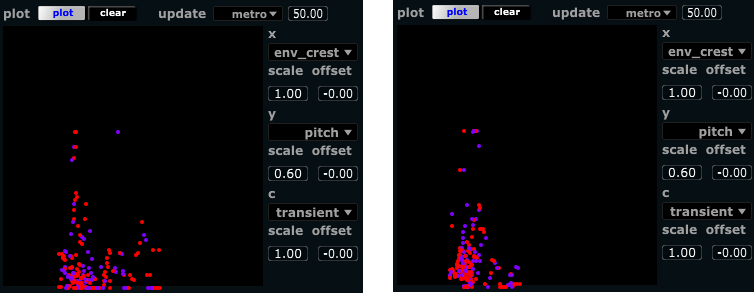
During the last few weeks, I’ve added some new things to the analyzer. Some new feature extraction parameters, some small fixes, and also a 2D plotting of parameters. The plotting makes it much easier to see correlations between extracted features, and as such is valuable both to familiarize oneself with the feature extraction methods, but also in the work of cleaning out redundant analysis parameters. First to the new parameters:
Envelope crest factor : This is what one would normally call just crest factor in audio engineering, but since we use the same kind of measure on different dimensions, we will use envelope crest factor or jus envelope crest as its name. The crest factor is technically the peak value divided by the RMS value, in this case of the amplitude envelope. This ratio of the peak to the average value gives an indication of the range of activity. In our project we also measure the crest factor of other dimensions, like the spectral crest, and the crest of the rhythmic autocorrelation. For our purposes, we can use the envelope crest factor to determine the “percussiveness” of a signal; if the audio signal is dry and staccato, with short attacks and clear pauses between them, then the envelope crest will be high. For sustained tones (and for silence), the envelope crest will be low. The initial experimentation with this parameter has led med to wish for another variant of it, an active dynamic range analysis, where one could distinguish between clear staccato rhythms with a high degree of dynamics (as opposed to staccato rhythms with a stable/steady dynamics).
Transient density: Now got a better algorithm for calculating this analysis parameter. It reflects the number of transients per second, and will naturally fluctuate a bit. A filter with fast rise and slow decay time has also been applied to it, so it will slowly dwindle back to zero when activity stops.
Plotting
The analyzer now has a 2D plotting area, inspired from seeing that Miller Puckette did something similar when we experimented with some analysis methods in PD. The plot does not have a control function, so does not actually produce any modulation data by itself, rather we can use it to look at how the signals behave over time. We can also see how different analysis features correspond to different kinds of playing, leaving different traces in the plot. The ability to see how much the different analysis features correlate also makes it easier to find which features are relevant for use as modulators and which ones perhaps is redundant. We can plot signals along 3 dimensions: x, y, and colour. The X axis goes from left to right, the Y axis from bottom to top, and the colour follows the rainbow from red to blue (maxing out at violet).
Plotting is enabled by clicking the button “not” (changing it into “plot”), and it can be cleared with the clear button. The plot has a set maximum of items it can plot (currently 200, although this can be set freely in the analyzer.csd code). When the maximum number of items has been plotted, we begin re-using the available items. This creates a natural decay of the plotted values, as older values (200 measurements ago) will be replaced by more recent ones. The plot update method can be set to be periodic (metro), with a selectable update rate (number of points per second). Alternatively, it can be set to plot values for every transient in the audio signal. In the case of the transient triggered plotting, the features of interest may not have stabilized at the exact time of the transient. For this reason we added a selectable delay (plot the value reached N number of milliseconds after the transient). Here’s some screenshots; First two situations of long, quite steady, held notes; Then two situations of staccato fluctuating melodies. The envelope crest is plotted on the X axis, the pitch on the Y axis, and the transient density represented by colour.


