
We have been searching for some way of extracting perceptually significant timbral qualities. One such quality could be the “pressedness” or “tension” of a sound. One could think of this similar to the amount of effort or energy put in by a performer of the sound. Some sort of musical intensity of intention. The term is a bit vague, but we assume it could be musically useful to be able extract such a timbral pressedness.
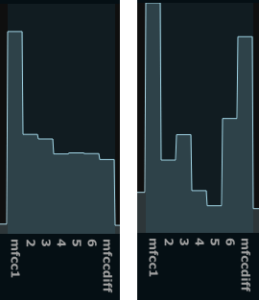
When playing around with the display of the first few bands (4-5 band) of the Mel frequency cepstrum coefficients (MFCC), I noticed that certain sounds would make certain unique distributions (shapes one could say) between these bands. Lets look at for example the first few MFCCs of a relaxed vocal “a”, and compare it to the same image of a pressed “a”.
Then similarly for a relaxed and a pressed vocal “i”:
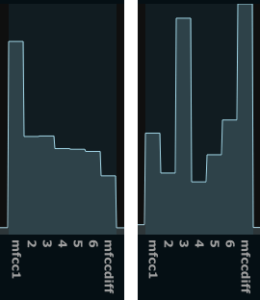
As we can see the relaxed sounds are relativelly flat in the first few MFCC bands (except for the first one), but the more pressed sounds are more peaky. Even though the peaks will fall in different locations on different pressed sounds (and also fall differently is we change the MFCC analysis parameters), there is a clear indication that spiky shapes follow more pressed sounds. A more scientific way of explaining it would be that the formants are more pronounced, and thus creating peaks in the MF cepstrum. Now, lets look at a noisy “shhh” sound:
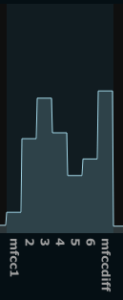
Here we also notice a certain peakyness, but more notably, the first MFCC coefficient is very low. With the first MFCC indicating the first harmonic of the MF cepstrum, it correlates well with the general balance between low and high frequencies (higher values when we have more energy in the lows). Since the “shh” sound is quite flat, this will give a low MFCC1 value. Still, disregarding the actual placement of the peaks, and generalizing the “pressedness” of the sound, we could state that a noisy shh is a more pressed timbre than a tonal “a” for example.
So, as a simple way of getting a measure of the peakyness we can just simple sum the absolute difference of the first few MFCC bands and use this as our measure. This is what is shown in the images above as “mfccdiff”. For clarity, here’s the formula:
Now, this has so far only been tested on vocal input. I am confident that the differences will not be so clear on other instrumental signals. But it still seems a reasonable feature extraction method to include in further experimentation.
 appropriate to note anyway. During the blog writing about the